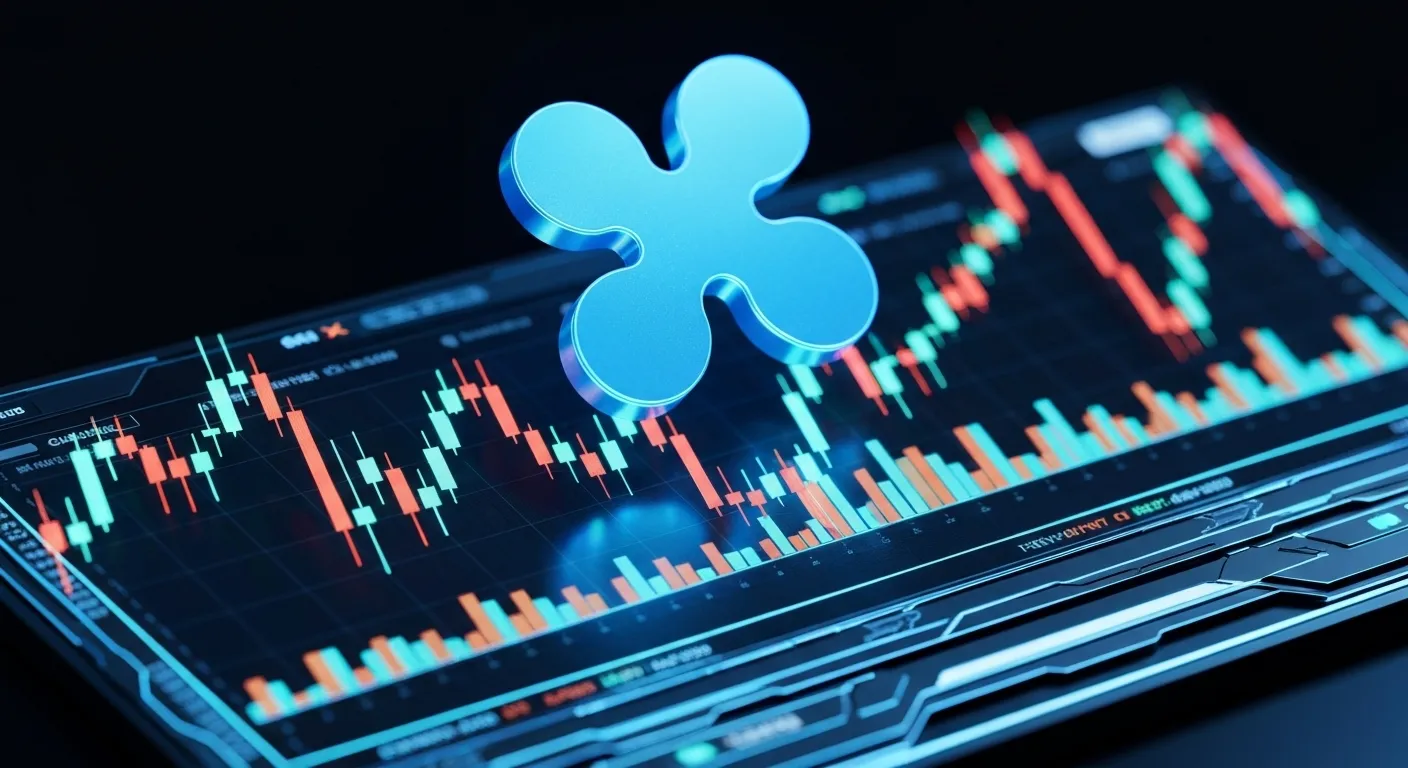
XRP, the digital asset designed to facilitate global payments and the native cryptocurrency of the Ripple network, has consistently been a high-volatility, high-interest asset in the crypto market. Its trajectory is often dictated not only by typical crypto market dynamics but also by the significant impact of its regulatory landscape, particularly in the United States. As of August 7, 2025, XRP is trading around $2.97. In the short-term, the price has experienced minor pressure, dipping by 0.11% in the last 24 hours and a more noticeable 5.43% over the past week. However, veteran traders recognize this recent dip as potentially just a minor correction following a substantial upward move, and there is palpable buzz about the asset's next major leg up. The market is keenly watching to see if XRP can leverage the favorable momentum stemming from recent clarity in its legal battles to initiate a powerful, sustainable breakout. The key to answering the question is a rally imminent? lies in a thorough technical dissection of its current price action, volume metrics, and the positioning of key momentum indicators.
---
Decisive Battle Lines: Analyzing Support and Resistance
Examination of the daily and weekly charts reveals that XRP is currently positioned in a high-stakes tug-of-war between buyers and sellers, defined by critical horizontal price levels. The immediate, vital support level sits at 2.78. This is a highly significant zone that has been repeatedly tested by sellers in the preceding weeks and has consistently demonstrated its resilience, acting as a crucial floor. The ability of the market to sustain the price above 2.78 is the most immediate bullish confirmation traders require. A strong influx of buying volume at this level suggests an underlying conviction from long-term holders and institutional players. Should the price fall decisively below this point an event typically accompanied by a spike in selling volume it would signal a structural shift, likely activating stop-loss orders and opening the door for a deeper correction. The next major demand zone, which represents a much more formidable line of defense, is positioned at 2.47. This level has historically been a strong accumulation point, aligning with a major Fibonacci retracement zone from the prior impulse wave. A drop toward 2.47, while concerning for short-term holders, is often viewed by strategic investors as a prime opportunity to acquire the asset at a discount. If this level fails, the downside risk extends toward the psychological support at $2.20, an area where aggressive buyers might step in for the final time before a possible protracted downtrend.
On the upside, the path to a rally is obstructed by the immediate and stubborn resistance at 3.05. This level has recently served as the ceiling, repelling several attempts by buyers to push through. For a rally to be considered truly ignited, XRP must achieve a sustained breakout and a high-volume daily candle close above 3.05. A successful breach of this barrier would clear the way for a rapid ascent toward the next major resistance cluster, which is centered around the recent high of 3.50. The 3.50 target is highly sought after as its successful breach would confirm the continuation of the short-term uptrend and likely lead to a surge in positive market sentiment and media coverage. Beyond this point, the market attention shifts to the formidable psychological barrier of 4.00. Clearing 4.00, especially if fueled by a decisive positive outcome regarding its regulatory status or major partnership announcements by Ripple, could trigger a parabolic move, potentially putting the all-time high back into play. The key differentiator for a successful breakout versus a fake-out will be the accompanying trading volume; a significant volume spike upon breaking 3.05 and 3.50 is mandatory to validate the move.
---
Decoding the Momentum: Insights from Technical Oscillators
To gauge the market's internal strength, we turn to the key momentum indicators. The Relative Strength Index (RSI) on the daily chart is hovering near the 58 mark. This reading is notably constructive, as it indicates a healthy bullish momentum without signifying an overbought condition (typically above 70). The space between 58 and 70 suggests that XRP has ample room to appreciate before buyers experience momentum exhaustion. For bulls, the goal is to see the RSI continue its ascent and remain firmly above the 50 centerline, confirming a dominant buying trend. A dip below the 50 level would raise concerns about short-term strength. Next, the Moving Average Convergence Divergence (MACD) indicator provides a more nuanced picture. Currently, the MACD line is flattening and is approaching a potential bearish crossover with the signal line. While not yet a sell signal, this convergence hints at a slowdown in the upward momentum that followed the last swing. Traders should treat a confirmed bearish MACD crossover where the MACD line drops below the signal line and the histogram flips negative as a high-alert warning for a potential short-term pullback toward the $2.78 support. Conversely, a renewed widening of the MACD lines and a growing positive histogram would powerfully confirm the continuation of the bullish trend.
In terms of trend-following metrics, the 50-day Exponential Moving Average (MA50) is currently positioned around 2.65. Crucially, the current price of 2.97 is trading comfortably above the MA50, affirming a solid bullish outlook for the medium term. The MA50 is now acting as a dynamic support level; holding above it is a strong confirmation that the primary trend remains positive. A decisive move below the MA50, however, often acts as a sell-off catalyst. Furthermore, the 200-day Moving Average (MA200), the long-term trend barometer, is likely positioned significantly lower, reinforcing the long-term bullish structural integrity of the asset. The interplay of these moving averages suggests that while short-term pressure exists, the medium-to-long-term trend favors the bulls.
---
Chart Patterns, Contextual Factors, and Strategic Execution
On the 4-hour chart, the price action has been consolidating within a recognizable descending triangle pattern. This pattern is formed by a flat, horizontal support base (near 2.78) and a descending trendline of lower highs. While technically a continuation pattern that often resolves in the direction of the underlying trend, the descending triangle is typically viewed as a potential bearish formation when formed at the top of a significant move, suggesting exhaustion. The ultimate direction of the breakout from this pattern will dictate the immediate future of XRP. A strong move above the upper trendline, which aligns closely with the 3.05 resistance, would signal a powerful rally toward 3.50 and potentially 4.00. Conversely, a breakdown below the 2.78 support would trigger a quick drop to 2.47. The probability of an upward resolution is significantly boosted by the fundamental context; the recent and ongoing legal and regulatory clarity for Ripple (the company associated with XRP) provides a foundational layer of optimism that technical patterns alone cannot capture. This fundamental strength often serves as the catalyst required to force a bullish breakout from consolidation patterns.
For traders, the current environment demands a blend of patience, vigilance, and strict risk management. The most opportune long entry would be on a bounce from the 2.78 support, with a precisely placed stop-loss beneath the 2.47 structural support to mitigate significant loss. Alternatively, a more aggressive strategy could involve waiting for the confirmed breakout and retest of the 3.05 resistance level. For those with a bearish bias, a position should only be considered upon a high-volume, confirmed breakdown of the 2.78 support, targeting the 2.47 and 2.20 zones. The overall market outlook is one of cautious optimism; XRP is sitting on strong fundamental support and a technically sound structure. However, the influence of Bitcoin's price action cannot be overstated, as a major move by the market leader will invariably override smaller altcoin patterns. The next few trading sessions are crucial as volume needs to return and dictate whether the descending triangle resolves bullishly into a rally, or bearishly into a deeper correction. XRP's next major surprise move is ready to unfold, and traders must be prepared for either direction.
Market Analysis
Neutral
70%
The article predicts a cautiously bullish short-term trend for XRP, but key resistance levels need attention.
Key Points:
- XRP Technical Analysis
- Support and Resistance Levels
- Market Indicators
Resources & References
Sources and additional reading materials
5
Frequently Asked Questions
Common questions about this topic
What are the key support levels for XRP right now?
Key support levels are around $2.78 and $2.47, identified as potential price reversal points.
Will XRP soon reach $3.5?
If it breaks the $3.05 resistance with strong volume, a move to $3.5 is possible.
What does the RSI indicator show for XRP?
The RSI is around 58, indicating mild bullish momentum without being overbought.
Why has XRP been volatile recently?
Recent volatility stems from a correction after hitting $3.65 and macroeconomic influences.
What’s the best strategy for trading XRP now?
Waiting for confirmation of key level breakouts and using stop-loss orders is advisable.